• Home
  • About
  • Toolbox
  • Contact

Advertangle

digital marketing and more

Divi WordPress Theme
  • Content
  • Deals
  • Design
  • SEO/SEM
  • Social
  • Tools
  • Others
You are here: Home / Design / 5 Steps to Create Infographic in Piktochart

5 Steps to Create Infographic in Piktochart

By Marta 1 Comment

Discover 5 Steps to Create Infographic in Piktochart. Creating one with this app is a pleasure, it's fast and easy. Pitkochart without a doubt is one of those programs, that can change your life, at least your working routine. Literally. It will hugely fasten your work and take away some of your responsibilities in a matter of seconds. Find out why.

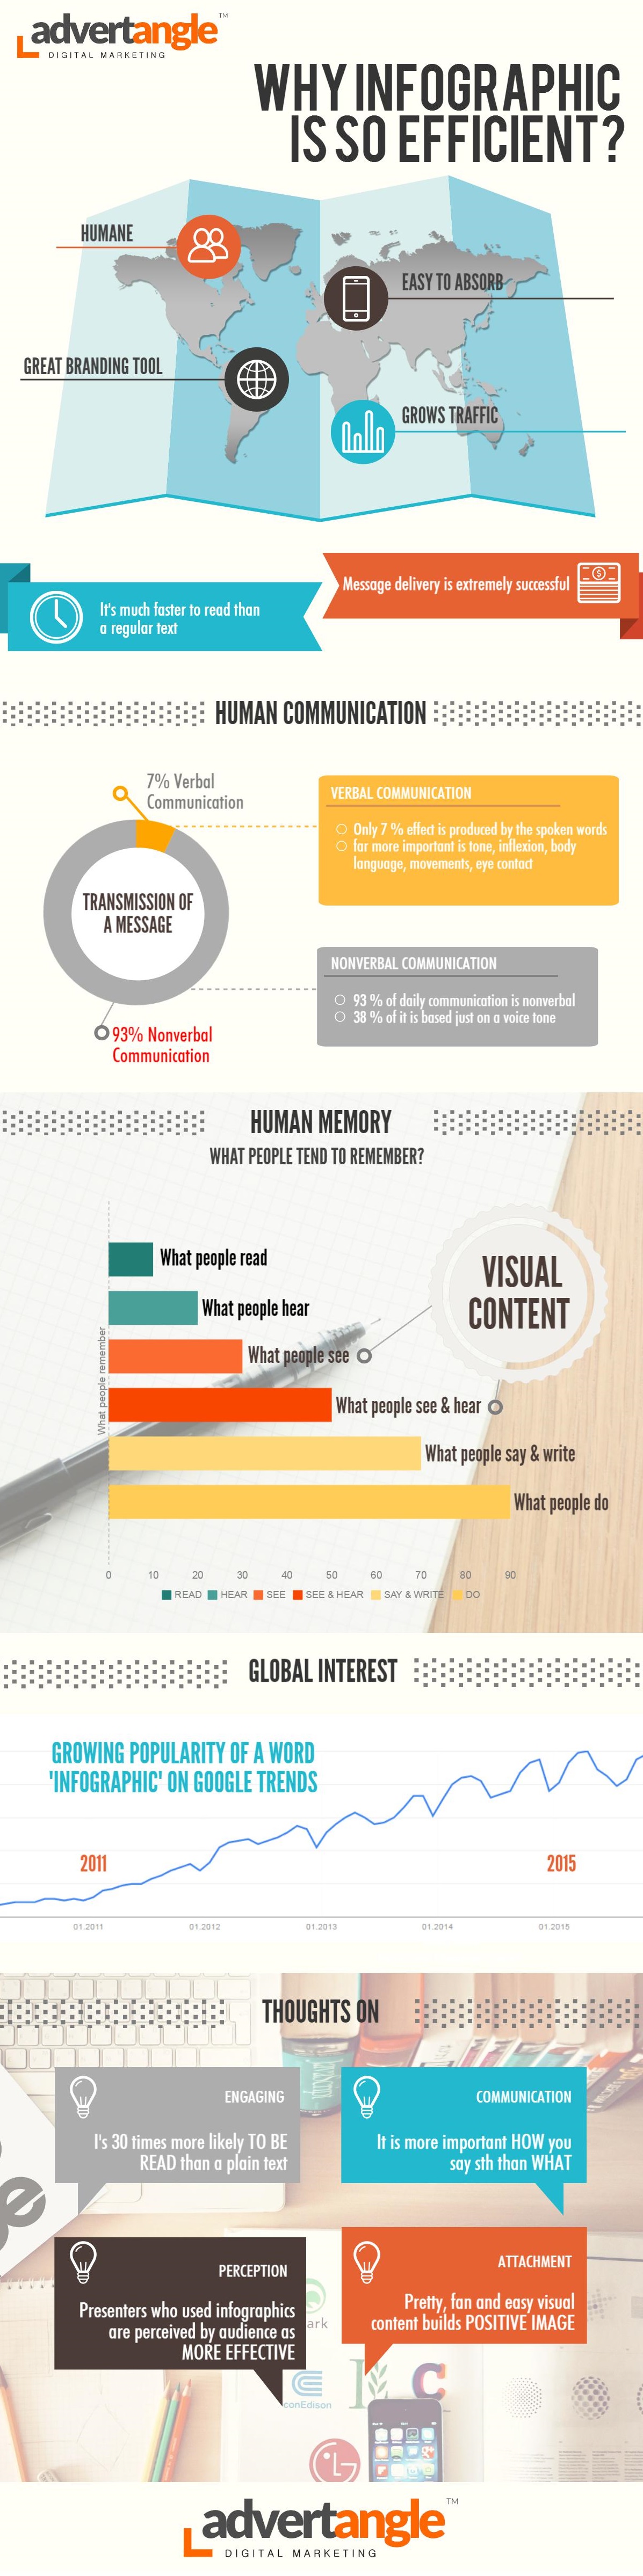
First of all, let's ask one general question: why infographic works? Why does it bring superb results? There is no better way to explain it than to present one.

5 Steps to Create Infographic in Piktochart.

What makes Piktochart a great infographic design app?

This application was made by Piktochart Infographics. It was launched in 2011 in Penang and since that time has gained 3,000,000 users and there is no question why. First of all, it's for free (and it will be). Secondly, it's extremely easy to work with, even without graphic experience. Last but not least, it's really nice to look at.

Piktochart's Design

You can create modern, useful and beautiful graphics, posters, presentations including complicated charts, pictures and tables. I'm in love with possibilities that it gives. How visually compiling can simple chart be?

Piktochart's Simplicity

It recuires minimum effort and knowledge to create a design. Pikcotchart is super userfriendly app. The idea behind it was to make it really easy for users to create and present their own ideas in clear, comfortable and efficent way. It had to be simple, fast and pretty and Piktochart's Team made it happen.

Piktochart's Costs

It can cost you nothing. Literally. This app is for free and the lifetime access is granted. However it is limited in other ways, not all options are available without payment. You can easily use Pictochart without paid upgrades and create your content for free.  However, upgrading is quite tempting. For example, with Piktochart Pro Package you can get:
  • access to all templates (and there are many of them),
  • image upload limit up to 400mb,
  • Hi-Res image exports,
  • High quality PDF exports,
  • Piktochart watermark automatic removal,
  • removal of the Piktochart logo,
  • more privacy options,
  • integrated export platforms.

5 Steps to Create Infographic in Piktochart

How to prepare an infographic in Piktochart? It can really take just 5 steps to finish one.

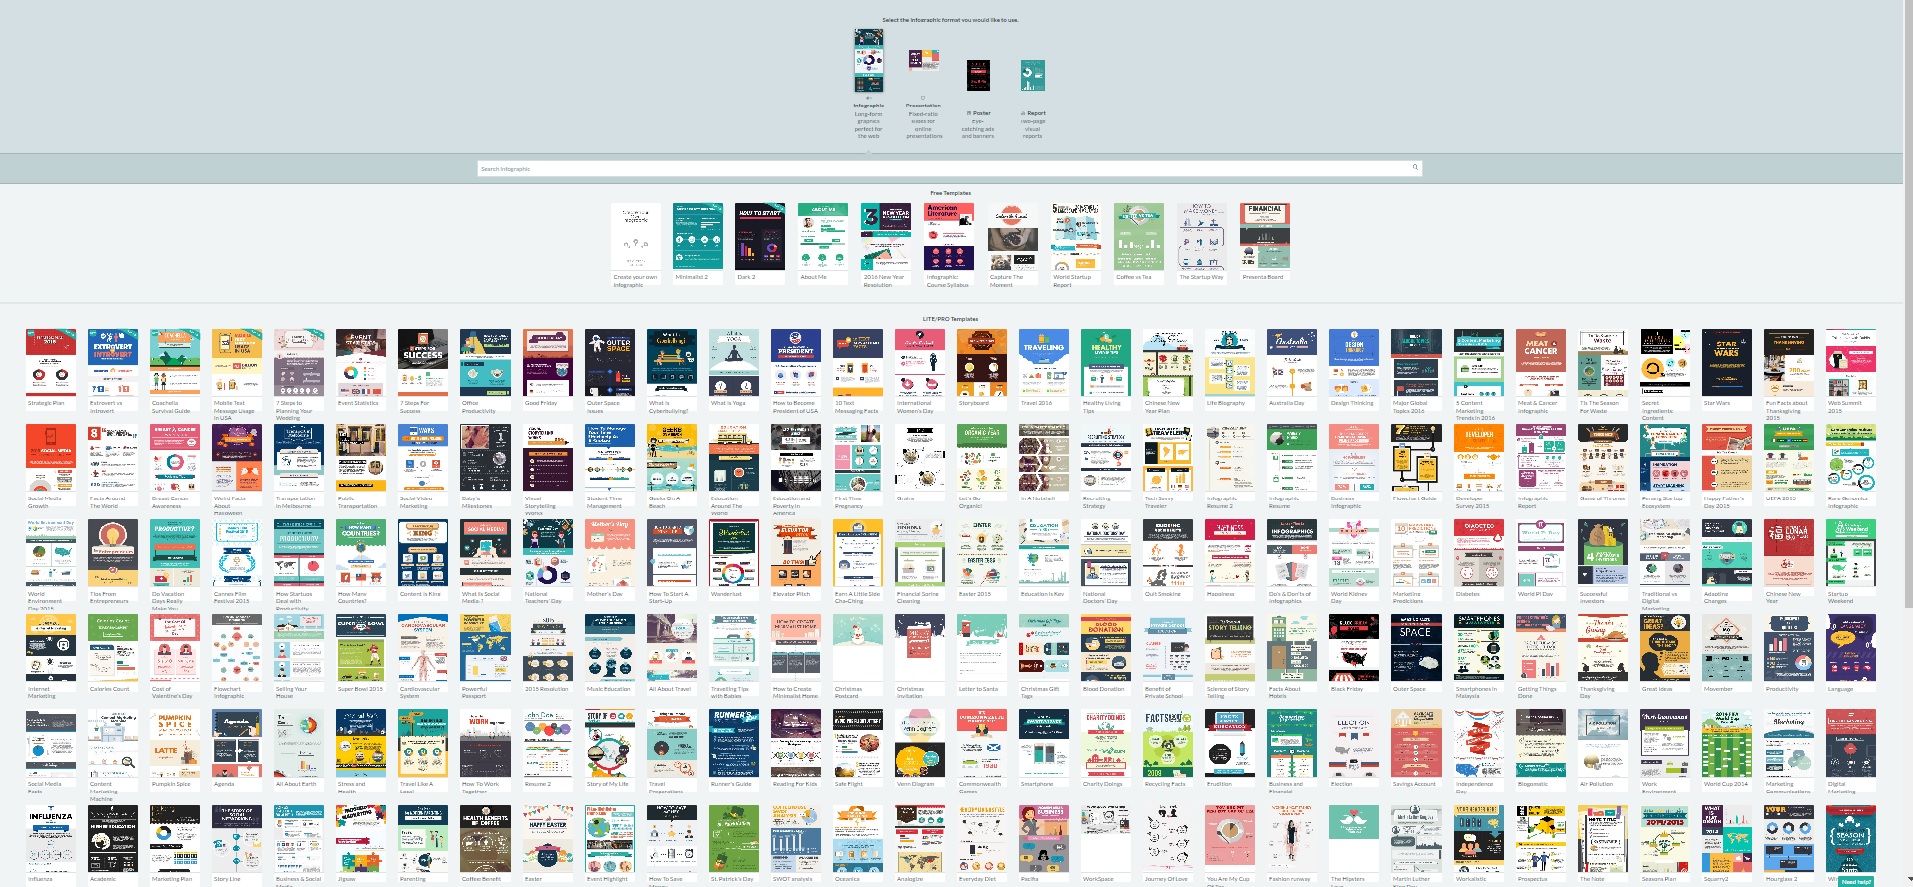
1. Choose a template

Your first step would be to select the most proper infographic format: poster, presentation, report or infographic. Secondly you should choose one from free templates. Choosing a template makes it really fast to create a complete infographic. However, you can work on your own from the very beginning and just ignore them. There are few free templates for each format. With paid version of Piktochart you get access to many more.
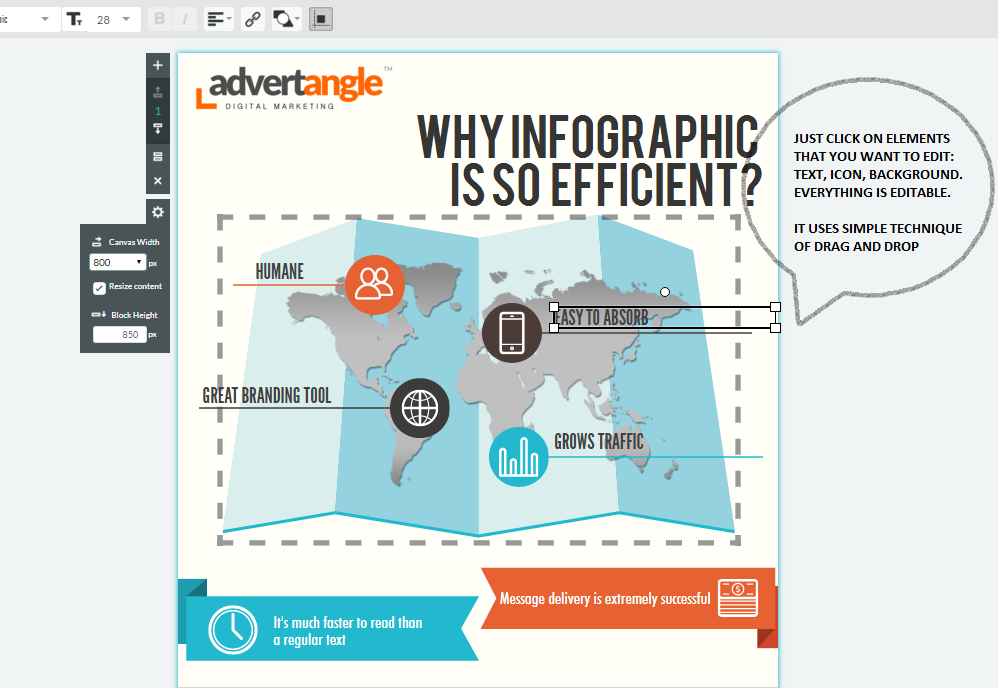
5 Steps to Create Infographic in Piktochart
5 Steps to Create Infographic in Piktochart. Pick a template.

2. Edit everything

You can edit whatever you want to be changed. It can be text, chart, background, logo or title. Pitkochart uses drag and drop technique. You can move all elements, make them transparent or vanish. You have access to free graphics (various shapes, icons, photos, lines), backgrounds, texts, fonts and tools. Working with it is very simple and intuitive.

5 Steps to Create Infographic in Piktochart
5 Steps to Create Infographic in Piktochart. Edit whatever you want.


5 Steps to Create Infographic in Piktochart
5 Steps to Create Infographic in Piktochart. Pick and custom all accesible elements.

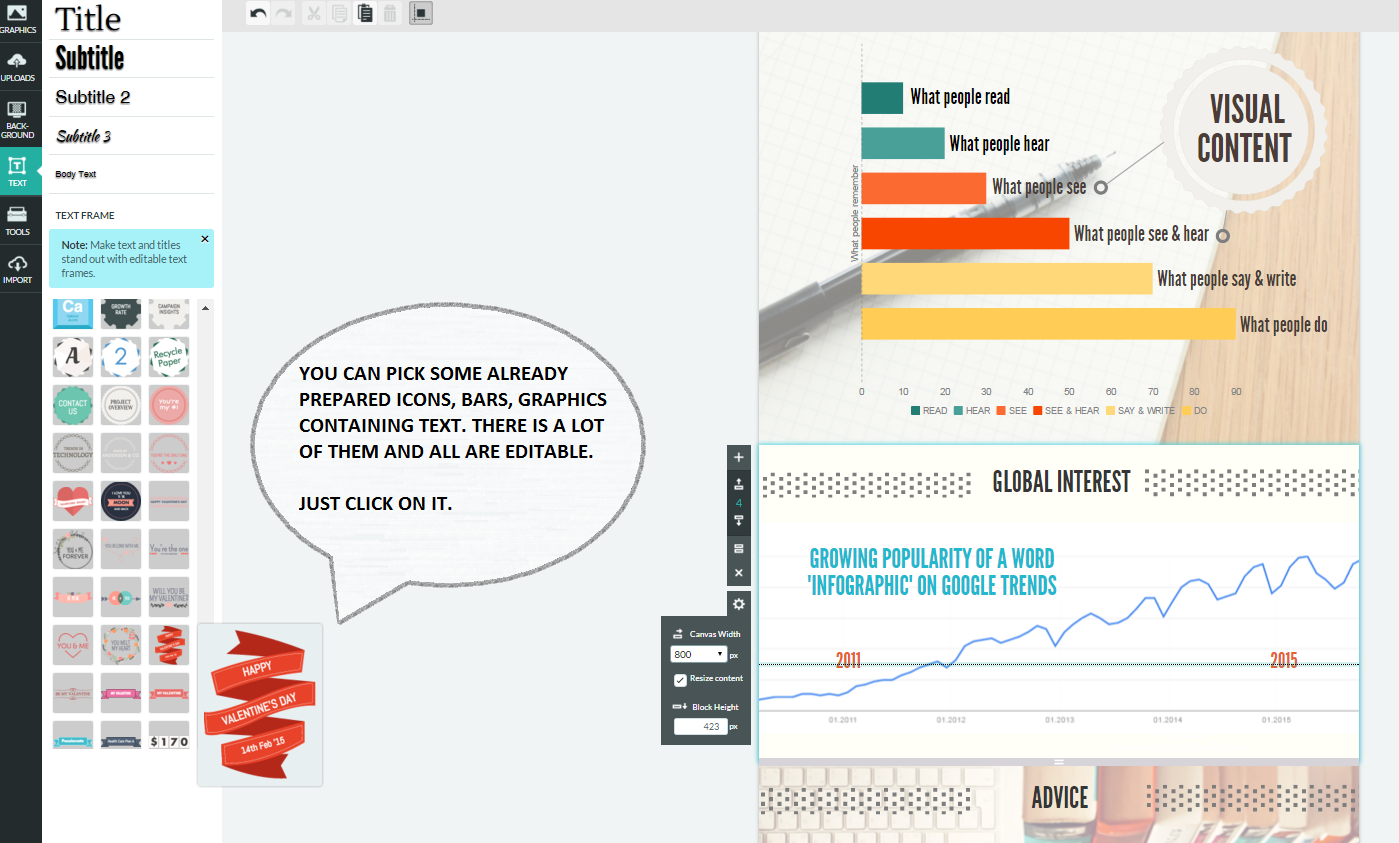
3. Use your graphic content

You are able to use your own graphic content, pictures, logos, signs. You just need to upload them. You have up to 40 MB space to store your graphics.

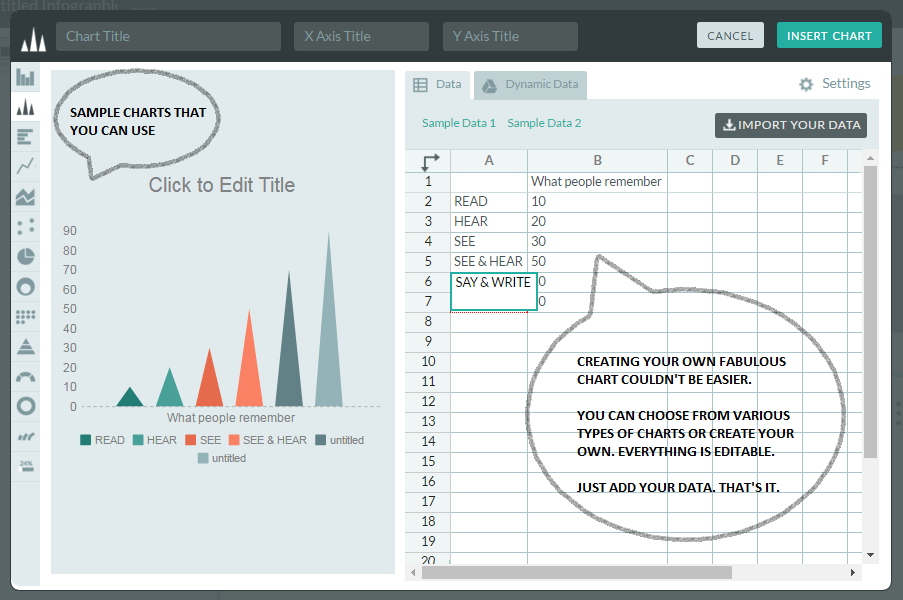
4. Visualize your data

Creating your own charts couldn't be easier. You can choose from variety of samples. Then fill chosen one with your data.  You can change all the colors, write your explanation etc.

5 Steps to Create Infographic in Piktochart
5 Steps to Create Infographic in -Piktochart. Visualize your data!

5. Download or share

Congratulations, that's it, you've done it! 

More information you can find on Piktochart's website. Tell me if you find this text useful. What do you create today?

Related Posts:

  • Why Should You Use VPN? Discover great benefits of VPN
  • Divi - is it worth to buy it?
  • Tesla Themes is now WPRealEstate
  • End of Vidnami
  • Black Friday Deals for Developers

Related posts:

No related posts.

Filed Under: Design, Tools

About Marta

Marta, founder & author of Advertangle.com - more about

Trackbacks

  1. Information Design - What Is It? How to Use It? - Advertangle says:
    3 July 2016 at 12:19

    […] There are many tools, also free, that you can use to design your information. For example, I can recommend Pictochart – you can read more about this tool in a separate article. […]

    Reply

Leave a Reply Cancel reply

Your email address will not be published. Required fields are marked *

NordVPN

TOOLS

Tesla Themes is now WPRealEstate

Why Should You Use VPN? Discover great benefits of VPN

Amazingly useful tools to create catchy headlines

Amazingly Useful Tools to Create Catchy Headlines

5 Free Writing Tools

Amazing 5 Free Writing Tools

Long Tail Pro

Long Tail Pro – Key to SEO Success

Divi WordPress Theme

Menu

  • Start
  • About
  • Toolbox
  • Cookie Policy
  • Contact

Advertangle

Advertangle - digital marketing and more.

It's all about marketing via Internet and everything that is or can be connected with it:
media, public relations, branding, SEO, SEM, content marketing, social media, copywriting, storytelling, design, UX Design, web usability, new technologies… and so on.
Read more

Search

Copyright © 2023 Advertangle | advertangle.com